Case Study: The 1980 Gold Crash—Euphoria Meets Reality
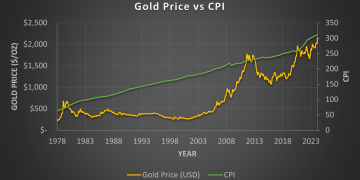
The story of gold’s dramatic rise and fall around 1980 is perhaps the most iconic episode in the metal’s history of corrections. After nearly a decade of surging inflation, geopolitical turmoil, and collapsing faith in the U.S. dollar, gold prices exploded from about $100 per ounce in the mid-1970s to an all-time high of $850 per ounce in January 1980. Yet almost as quickly as gold skyrocketed, it plummeted, shedding more than 50% of its value within a few months. Several factors converged to create this epic correction. First, central banks led by the U.S. Federal Reserve, under Chairman Paul Volcker, launched an aggressive campaign to crush inflation by raising interest rates to unprecedented levels. Real interest rates, which had been deeply negative, suddenly turned positive, making bonds and cash far more attractive compared to non-yielding assets like gold. Second, speculative fervor had reached unsustainable levels. Media coverage, investor enthusiasm, and rapid price escalation created a bubble-like environment where fundamentals became detached from sentiment. When prices faltered, panic selling ensued, exacerbating the downturn. Importantly, the 1980 crash revealed that while gold is a reliable long-term hedge, short-term speculation can lead to devastating losses. Investors learned the hard way that buying into an overheated market without regard to fundamentals or broader economic shifts can be financially ruinous. The 1980 crash served as a wake-up call that even in the case of gold, valuations matter, and macroeconomic policies, particularly regarding interest rates, can dramatically alter investment outcomes.
Case Study: The 2011 Peak—Fear-Driven Highs and Slow Burn Decline
The second major gold correction of the modern era unfolded after the metal’s spectacular rise following the 2008 Global Financial Crisis. Gold soared from around $700 per ounce in late 2008 to a record high of over $1,900 per ounce by September 2011. The drivers were clear: fears of systemic banking collapse, sovereign debt crises in Europe, aggressive monetary easing by the Federal Reserve, and widespread anxiety over the debasement of fiat currencies. However, just as in 1980, once the immediate crises began to subside, gold’s rally lost momentum. As central banks started signaling future tightening measures and as economic indicators gradually improved, the risk-on sentiment returned to global markets. Equities surged, and appetite for safe havens like gold waned. Importantly, the 2011 peak differed from the 1980 event in its aftermath. Instead of a violent crash, gold embarked on a multi-year grind lower. By late 2015, prices had fallen to around $1,050 per ounce, marking a nearly 45% decline from the peak. The slow, grinding nature of this correction was a painful reminder that while gold’s uptrends can be explosive, its downtrends often involve prolonged periods of underperformance rather than sudden collapses. Investors caught at the highs faced years of underwhelming returns and opportunity costs as other asset classes outperformed. The 2011-2015 correction highlighted how changes in monetary policy expectations, improving economic data, and shifting investor sentiment can steadily erode gold’s allure. It also underscored the importance of watching not just current events but forward-looking indicators like central bank policy guidance, real interest rates, and inflation expectations.
Case Study: The 2020 Surge and Aftermath—A New Era of Volatility
The COVID-19 pandemic delivered another historic moment for gold. In early 2020, as global economies locked down and markets panicked, gold initially dropped alongside equities in a liquidity-driven selloff. But soon, as central banks flooded the world with liquidity and governments launched massive stimulus programs, gold took flight. By August 2020, it had set a new record of over $2,070 per ounce. Unlike past surges, the 2020 rally was driven not just by inflation fears or geopolitical turmoil but by a combination of pandemic uncertainty, zero or negative real interest rates, ballooning fiscal deficits, and concern over currency debasement. However, gold’s lofty heights once again proved unsustainable in the short term. As vaccines were rolled out and economic reopening gained momentum, risk appetite returned, sending equities soaring and sapping demand for defensive assets. Moreover, rising Treasury yields in 2021 made holding non-yielding assets like gold less attractive. Gold corrected sharply, falling back toward the $1,700–$1,800 range. The 2020 surge and subsequent pullback reflected a new era of gold market behavior—one characterized by rapid shifts in investor sentiment driven by both traditional economic indicators and newer factors like pandemic-related policy shifts and massive fiscal spending programs. It also highlighted gold’s sensitivity to real interest rate movements and the need for investors to remain nimble in the face of swift macroeconomic changes.
Signs to Watch for Future Correction Phases
Understanding the signs that typically precede major gold corrections can equip investors to navigate future market cycles more skillfully. One key signal is the behavior of real interest rates. When inflation-adjusted yields on government bonds rise, gold becomes relatively less attractive because it does not generate income. Monitoring real rates, particularly those on U.S. Treasuries, provides valuable insight into gold’s risk-reward profile. Another critical indicator is the positioning of speculative investors. When futures market data reveals excessively bullish sentiment among hedge funds and retail traders, caution is warranted. Historically, extreme long positioning has often preceded major pullbacks. Changes in central bank policy, especially unexpected shifts in interest rate paths or quantitative tightening measures, also serve as early warning signs. Gold tends to perform poorly when monetary conditions tighten abruptly or when markets anticipate sustained rate hikes. Similarly, broader shifts in investor sentiment—such as a renewed appetite for risk assets like stocks or cryptocurrencies—can drain liquidity from the gold market and trigger corrections. Technical analysis can also offer clues. Extended periods of parabolic price action, rising volumes during price declines, and breakdowns of key support levels often herald deeper corrections. Macroeconomic indicators such as stronger-than-expected GDP growth, improving employment figures, and declining inflation can likewise diminish gold’s safe haven appeal and set the stage for market reversals. Finally, geopolitical developments must not be overlooked. While crises often boost gold prices initially, resolutions or de-escalations can lead to swift unwinding of safe haven trades, triggering corrections.
Conclusion
The history of gold corrections—from the dramatic crash of 1980, the grinding downturn after the 2011 peak, to the volatile aftermath of the 2020 surge—provides invaluable lessons for modern investors. While gold remains a vital component of a diversified portfolio and an effective hedge against various risks, its price trajectory is far from linear. Investors must be vigilant, monitoring economic indicators, central bank policies, real interest rates, and speculative positioning to anticipate potential turning points. Recognizing the warning signs of overheating markets and understanding the fundamental drivers behind gold’s appeal can help investors avoid the pitfalls of past corrections. In a world where financial markets are increasingly influenced by both traditional forces and new global dynamics, a nuanced approach to gold investing—grounded in historical understanding and forward-looking analysis—will be essential for success. As we look ahead, the lessons from past gold corrections remain as relevant as ever, reminding us that while gold may glitter, its path to higher prices is often paved with volatility, reversals, and resilience.


