


Introduction: Gold’s Historical Significance and Price Fluctuations
Gold has long been considered a safe-haven asset, one that retains value through turbulent economic times. It is unique in its ability to withstand the test of time, emerging as a trusted store of value across centuries. As a commodity, gold is influenced by a complex mix of factors, ranging from geopolitical instability and economic recessions to inflationary pressures and shifts in investor sentiment. Over the last 50 years, the price of gold has seen notable fluctuations, often influenced by major historical events.
This article takes a deep dive into the historical price trends of gold, aiming to identify recurring patterns, economic triggers, and potential forecasts for the future. By studying gold’s behavior during times of crisis, market surges, and economic booms, investors can better understand the dynamics that drive gold prices and make more informed decisions.
Overview of Major Historical Price Trends
Gold prices have experienced several defining cycles over the last 50 years. While no two periods are identical, certain patterns have consistently emerged, offering valuable insights into the forces that shape gold’s market behavior.
- The 1970s: The Rise of the Gold Standard and Inflationary Pressures
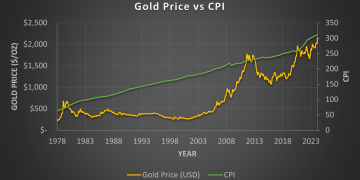
The 1970s marked a defining period for gold. After the collapse of the Bretton Woods system in 1971, which ended the U.S. dollar’s convertibility to gold, the metal was allowed to trade freely in the open market. This led to a dramatic surge in gold prices, which rose from around $35 per ounce in the early 1970s to an all-time high of $850 per ounce by 1980. This rise was driven largely by inflationary pressures and global economic uncertainty, particularly in the wake of the oil crises of 1973 and 1979. - The 1980s: A Period of Stabilization and Declining Prices
After the peak in 1980, gold prices entered a prolonged period of decline, dropping from their high of $850 to below $400 by the mid-1980s. This was largely due to a reduction in inflationary pressures, the stabilization of global markets, and the rise of other investment vehicles such as stocks and bonds. The U.S. economy also experienced strong growth during this period, which decreased demand for gold as a hedge against economic instability. - The 2000s: A New Gold Rush Amidst the Dotcom Crash and 2008 Financial Crisis
The early 2000s saw a resurgence in gold prices, as geopolitical tensions and a volatile stock market created uncertainty. In 2001, gold prices were hovering around $250 per ounce, but by 2008, they surged past $1,000 per ounce. The catalyst for this rise was the global financial crisis (GFC), which caused a massive devaluation of paper currencies, particularly the U.S. dollar. Investors flocked to gold as a safe haven, pushing prices upward. - The 2010s: Gold as a Hedge Against Global Economic and Geopolitical Risk
The period from 2010 to 2013 saw gold reach new heights, with the price peaking at around $1,900 per ounce in 2011. The catalyst was the European debt crisis, ongoing uncertainties about the global economy, and central banks’ loose monetary policies, including low interest rates and quantitative easing. However, after peaking in 2011, gold’s price again faced a correction, falling to around $1,100 in 2015, as market confidence slowly returned and investors moved away from the metal toward equities. - The 2020s: A Continued Surge Amid Pandemic and Economic Recovery
As the COVID-19 pandemic disrupted global economies, gold once again found itself in favor. By mid-2020, gold prices surged to historic highs of $2,070 per ounce, driven by the massive fiscal stimulus packages, low interest rates, and concerns about the long-term economic impact of the pandemic. The period of economic recovery following the pandemic saw fluctuating prices as markets adjusted to new realities, but gold continued to hold its position as a critical asset for portfolio diversification.
Identifying Cycles and Macroeconomic Triggers
One of the key questions for investors is whether gold’s price movements follow a predictable pattern based on certain cyclical triggers. Historically, four key macroeconomic drivers have played a central role in influencing the price of gold:
- Inflation and Currency Depreciation:
Gold has always been viewed as a hedge against inflation, especially in times when currencies lose their purchasing power. When inflation rises or when central banks print more money, the value of fiat currency falls, driving investors to gold as a store of value. The 1970s and the 2000s offer clear examples of gold’s performance in times of high inflation and currency devaluation. As the U.S. dollar weakens, gold often becomes a more attractive alternative. - Geopolitical Crises:
Global tensions—whether they are military conflicts, political instability, or trade wars—have historically driven gold prices higher. During the 2008 financial crisis, gold surged as fears of a global economic collapse took hold. Similarly, during periods of heightened geopolitical risk, such as the Gulf Wars or the 9/11 attacks, gold has served as a safe haven asset. - Economic Recessions and Financial Crises:
When economies are in a recession or when stock markets crash, investors often turn to gold to protect their wealth. The 2008 financial crisis was a textbook example of this behavior, as gold prices soared while stocks and real estate markets plummeted. Similarly, the economic downturn caused by the COVID-19 pandemic saw gold prices spike to new highs. - Interest Rates and Central Bank Policies:
Gold’s price is highly sensitive to interest rates. When interest rates are low, the opportunity cost of holding gold (which does not pay interest or dividends) is lower, making gold more attractive. Central bank policies, including quantitative easing, have also played a significant role in driving gold prices. For example, during the 2008 financial crisis and the COVID-19 pandemic, central banks’ stimulus programs led to increased demand for gold as an inflation hedge.
How Past Crises Impacted Gold Differently
While gold has consistently performed well during periods of economic or geopolitical turmoil, the nature of these crises has shaped the way gold reacts in different contexts. Each crisis offers unique lessons for how gold might behave in the future.
- The 2008 Global Financial Crisis:
In 2008, gold prices surged as the global financial system nearly collapsed. As markets crumbled, investors flocked to gold, which outperformed many other assets. This period solidified gold’s reputation as a safe haven. However, in the aftermath, gold’s price did not continue to rise indefinitely. As global economic conditions improved, confidence returned to equities, and gold prices fell back from their highs. - The 2020 COVID-19 Pandemic:
The pandemic’s economic fallout was distinct from past crises, as it was accompanied by unprecedented government interventions. While gold prices reached new highs during the crisis, they did not experience the same sharp upward trajectory seen in 2008. This time, fiscal stimulus packages and the massive injection of liquidity into financial systems raised concerns about future inflation, propelling gold to record levels. However, as economies began to recover, gold’s price fluctuated more than it had in previous crises, indicating a more complex relationship between gold and modern-day economic stress. - Geopolitical Tensions:
In times of geopolitical instability, such as wars or international conflicts, gold tends to see a rapid increase in demand. However, the market’s response can vary depending on the specifics of the conflict. In the case of the Gulf War or the annexation of Crimea, gold saw significant price jumps. However, geopolitical events such as the U.S.-China trade war had a more muted effect on gold prices, showcasing how market sentiment and investor behavior can vary depending on the nature of the crisis.
Forecasting Future Movement Using Pattern Recognition
By examining the past, we can attempt to identify recurring patterns in gold prices and use these insights to forecast future movements. While past performance is never a guarantee of future results, there are several key indicators and strategies that can be employed:
- Tracking Historical Cycles:
Gold’s price movements tend to follow certain cyclical patterns, especially during times of inflation or economic instability. By examining past cycles and identifying patterns in the data, investors can make more informed predictions about future price movements. - Geopolitical Risk and Economic Indicators:
Monitoring global political and economic events—such as elections, wars, or shifts in central bank policies—can provide early signals for changes in gold prices. Economic indicators like GDP growth, unemployment rates, and inflation data can also help predict when gold may experience upward or downward price movements. - Sentiment Analysis:
By utilizing sentiment analysis tools and AI-based predictive models, investors can gain deeper insights into market sentiment surrounding gold. This can help gauge whether gold is perceived as a safe haven or simply a speculative asset in times of crisis.
Conclusion: Understanding Gold’s Price Patterns for Smarter Investing
Gold’s price movements are undoubtedly influenced by a wide range of macroeconomic and geopolitical factors. Over the last 50 years, the metal has demonstrated a cyclical nature, with recurring patterns emerging during periods of inflation, recession, or geopolitical upheaval. Understanding these patterns can provide valuable insights into future price trends and help investors make more informed decisions.
However, it is essential to recognize that no two crises are the same, and past performance cannot always predict future movements. By integrating historical knowledge with modern tools like sentiment analysis and AI-based forecasting, investors can better navigate the complexities of the gold market and make strategic investment choices that align with their long-term financial goals.


