


Introduction: A 50-Year Snapshot of Gold’s Price History
Gold has long been a benchmark of financial stability, cherished for its role as a store of value and a hedge against economic turmoil. Over the past 50 years, the price of gold has seen dramatic shifts, influenced by geopolitical events, economic upheavals, and changes in global financial systems. This article takes a deep dive into the historical price movements of gold over the past five decades, identifies key drivers of price volatility, and explores how investors can use this data to make informed decisions moving forward. Additionally, we will examine how inflation and deflation have shaped the pricing of gold throughout history and how these factors continue to influence the gold market today.
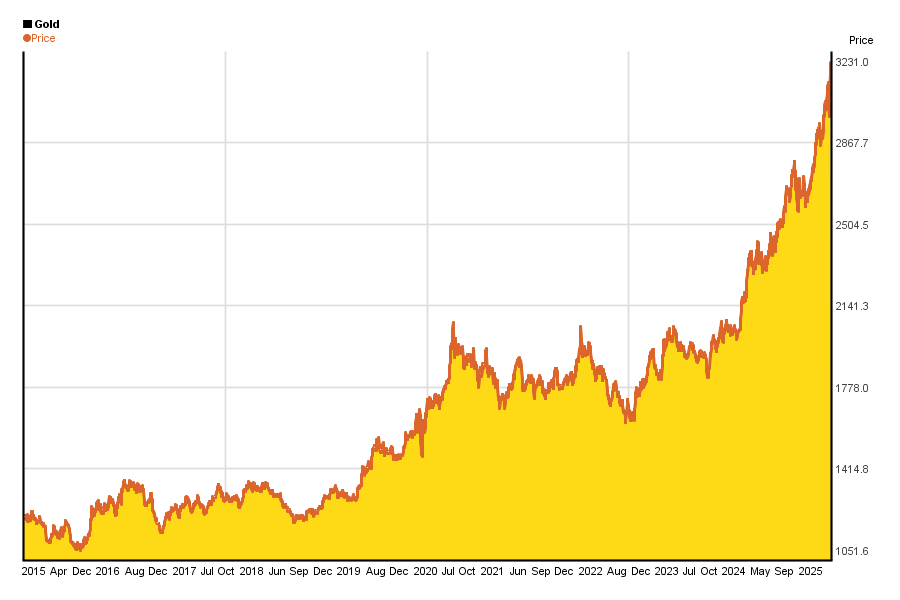
In-Depth Historical Data Analysis of Gold Price Trends Over the Decades
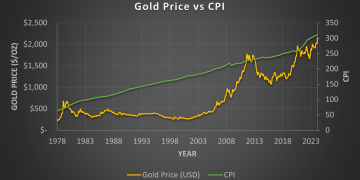
- 1970s: The End of the Gold Standard and the Rise of Inflation The 1970s marked a pivotal moment in the history of gold as the U.S. formally ended the Bretton Woods system in 1971. This shift meant that the U.S. dollar was no longer pegged to gold, and the value of gold was allowed to fluctuate freely in the market. Gold’s price surged during this period, from around $35 per ounce in 1971 to over $800 per ounce by 1980. This sharp rise was largely driven by inflation, as the U.S. experienced a period of high price increases, partly due to rising oil prices and the Vietnam War’s economic impact.
- 1980s: Stabilization and Gradual Decline After reaching an all-time high in January 1980, gold prices entered a period of stabilization. By the mid-1980s, gold was trading around $400–$500 per ounce, driven by a combination of high interest rates and relative economic stability. The gold price decline was also influenced by the strengthening of the U.S. dollar and the fact that inflationary pressures began to subside. The 1980s were characterized by a steady shift from inflation fears to deflationary pressures, which reduced gold’s appeal as a hedge against inflation.
- 1990s: The Quiet Years for Gold The 1990s saw a prolonged period of low gold prices, which hovered around $300 to $400 per ounce. This period coincided with the end of the Cold War and the economic boom in the U.S. following the collapse of the Soviet Union. The absence of significant geopolitical threats and the stable economic environment led to a reduced demand for gold, as investors found higher returns in equities and other investments. Central banks also began selling off substantial portions of their gold reserves, further putting downward pressure on the price.
- 2000s: The Gold Bull Run Begins Gold prices started to rise again in the early 2000s, reaching $500 per ounce in 2005, and climbing steadily throughout the decade. The financial crisis of 2007–2008 played a critical role in this resurgence. As global markets collapsed and central banks responded with low interest rates and massive amounts of liquidity, gold became a go-to asset for investors seeking a hedge against market volatility. By 2011, gold reached a new record high of over $1,900 per ounce, driven by fears of inflation, currency devaluation, and the continuing aftermath of the global recession.
- 2010s: The Gold Price Roller Coaster Following its peak in 2011, gold prices fluctuated throughout the 2010s. After a sharp decline post-2011, the price stabilized in the $1,100 to $1,300 range for much of the decade, with occasional spikes during periods of economic uncertainty. Central bank policies, particularly those of the U.S. Federal Reserve, had a significant impact on gold’s price during this period. Quantitative easing, low interest rates, and fears of global economic instability created an environment where gold was seen as a safe haven asset, though it never quite reached the heights seen in 2011.
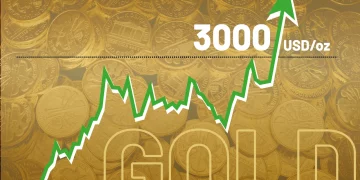
- 2020s: The COVID-19 Pandemic and Beyond The COVID-19 pandemic brought a new level of volatility to the gold market. In 2020, gold reached its highest price in history, briefly surpassing $2,000 per ounce, as central banks pumped trillions of dollars into economies to counteract the economic impact of lockdowns and reduced activity. As 2021 progressed, gold saw some price adjustments, but it remains a vital asset in times of economic uncertainty. Moving into 2025, gold prices are being influenced by ongoing concerns about inflation, central bank policies, and geopolitical instability, particularly in Europe and Asia.
Key Drivers of Gold Price Volatility
The price of gold is influenced by a multitude of factors, both macroeconomic and geopolitical. Understanding these drivers is essential for investors looking to navigate the gold market effectively.
- Political Instability Gold is often considered a safe haven during times of political turmoil. Events such as wars, regime changes, and diplomatic crises can lead to a surge in gold prices as investors flock to the precious metal for its stability. For example, the rise of gold in the 1970s was fueled by political events like the Yom Kippur War and the Iranian Revolution, which caused uncertainty in global markets.
- Economic Crises Economic downturns, like the 2008 global financial crisis or the 2020 pandemic, tend to boost gold prices. During these times, investors seek assets that can retain value when other investments, such as stocks or real estate, are suffering. The global financial system’s reliance on government intervention, monetary easing, and low interest rates often makes gold a better option for risk-averse investors.
- Inflation and Deflation Inflation has historically been a major driver of gold’s price. When inflation rises, the purchasing power of fiat currencies declines, making gold an attractive hedge. On the other hand, during periods of deflation—when prices are falling across the economy—gold prices tend to stagnate or decrease. The 1970s saw massive inflation in the U.S., which drove up gold prices significantly. In contrast, during the 1990s, the relative absence of inflation kept gold prices low.
- Supply and Demand Factors While demand for gold typically increases during times of economic uncertainty, supply issues can also affect the price. Gold mining production has slowed in recent years, and many countries are heavily reliant on gold imports to meet demand. These supply chain constraints can lead to price increases, especially in the face of rising global demand.
How to Use Historical Price Data for Future Predictions
Historical gold price data provides valuable insights that can be leveraged to make informed investment decisions. While no market is entirely predictable, understanding past patterns can help investors anticipate potential market movements.
- Identifying Cycles Gold has historically followed cycles of boom and bust, often in sync with broader economic trends. By analyzing historical data, investors can identify recurring patterns in gold’s price behavior and anticipate when similar events or conditions may lead to price increases or declines.
- Understanding the Role of Central Banks Central banks play a crucial role in shaping the price of gold. Observing their actions, such as gold purchases or sales, interest rate decisions, and monetary easing, can provide clues about future gold price trends. In particular, periods of high central bank intervention or currency devaluation tend to correlate with rising gold prices.
- Tracking Geopolitical Developments Monitoring geopolitical events, such as conflicts or trade wars, can help investors predict when gold might spike due to heightened risk aversion. By keeping an eye on global tensions, investors can time their gold investments more effectively.
The Role of Inflation and Deflation in Shaping Gold Prices
Inflation and deflation have played significant roles in shaping the price of gold over the last 50 years. Gold is often viewed as a hedge against inflation, as its value tends to rise when inflation is high. Conversely, during periods of deflation, gold can lose value as demand for safe assets wanes.
- Inflationary Periods Gold’s price surges during inflationary periods, as investors seek to protect their wealth from the eroding value of paper currencies. The 1970s inflation crisis is a prime example of how gold can outperform other assets during inflationary times.
- Deflationary Periods During deflation, gold prices may stagnate or even decline, as the real value of the metal becomes less significant compared to other investments. The 1990s, marked by low inflation and a stable economic environment, saw gold prices remain flat for most of the decade.
Conclusion: What Can We Learn from Gold’s Price History?
Gold has been an invaluable asset for investors throughout history, offering both protection against economic uncertainty and potential for long-term value growth. By examining gold’s price movements over the past 50 years, we gain a deeper understanding of the factors that drive its price. Key drivers of gold’s volatility include political instability, economic crises, inflation, and supply-demand dynamics. Understanding these factors, along with how historical data can be used to forecast future trends, provides investors with the tools they need to make informed decisions in today’s complex market environment.


